Product Metrics for Early Stage Startups
Startups exist to build products to solve problems. While revenue is an oft-used yardstick to measure the effectiveness of a solution, analyzing product usage behaviors is the most important direct indicator of how much customers love your product.
When I am digging into a company, I usually like to deep dive into product usage to investigate three important questions:
a) Does the product actually solve the user’s problem? (especially if the buyer is different from the end user)
(b) Is it a delightful and sticky user experience that the users love?
(c) Does the product drive a tangible, objective business outcome for the customer to justify cost of the product (the ROI)?
After surveying and working with early stage B2B and B2C companies, both successful and unsuccessful, over the past few years, I have distilled product usage measures the best founders use. These are great jumping off points for both B2B and B2C businesses and create a framework to enable entrepreneurs to go deeper into more granular insights about their specific product and customer persona.

The "Aha" Moment - Customer Activation Energy
I think of the "Aha" moment as the moment your product fulfills its value proposition to the customer. When the customer experiences your magical solution that solves the problem they have been struggling with.
Think of the Aha Moment as 💡 + 🤯
Here are some “aha” moments for popular products you might have used.
💻 Zoom: completing your first zoom meeting
🥕 Instacart: first batch of groceries delivered
📹 Twitch: when the streamer responded to my message live on air
🦾 Zapier: setting up a Zap & it runs for the first time automatically
A product is only effective, if users have an aha moment. The best products get their users to the “Aha” moment as soon as possible
So its important to track these two metrics: activation rate ("aha moment”) and time-to-value (“speed to aha moment”)
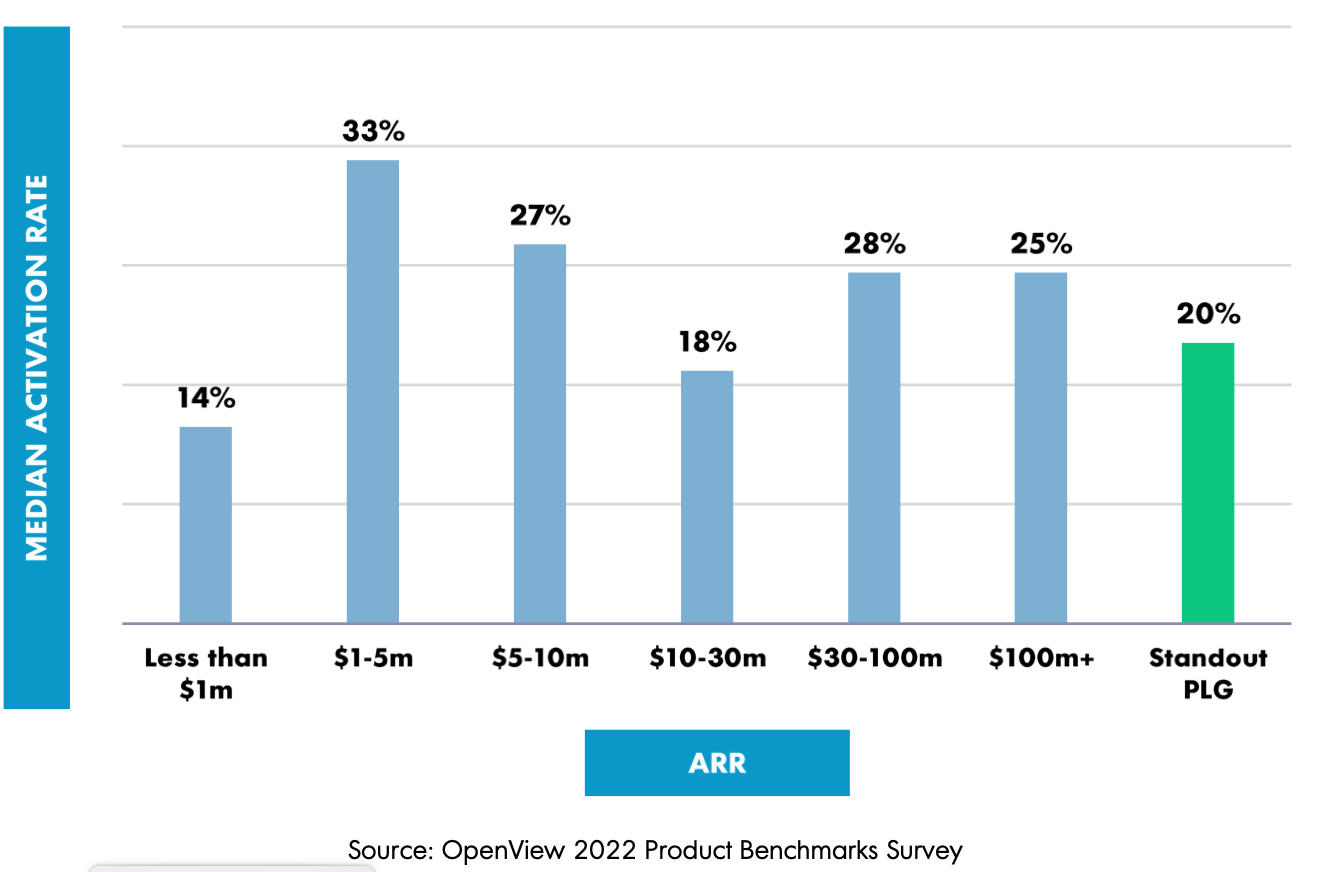
📈 Activation Rate: what % of signups / users get to their aha moment
This number should be as high as possible. Hard to engage and retain users if they never discover the magic of the product.
Activation Rate Formula: [Number of users who accomplish "Aha" moment milestone in a given period] / [Total number of onboarded users] * 100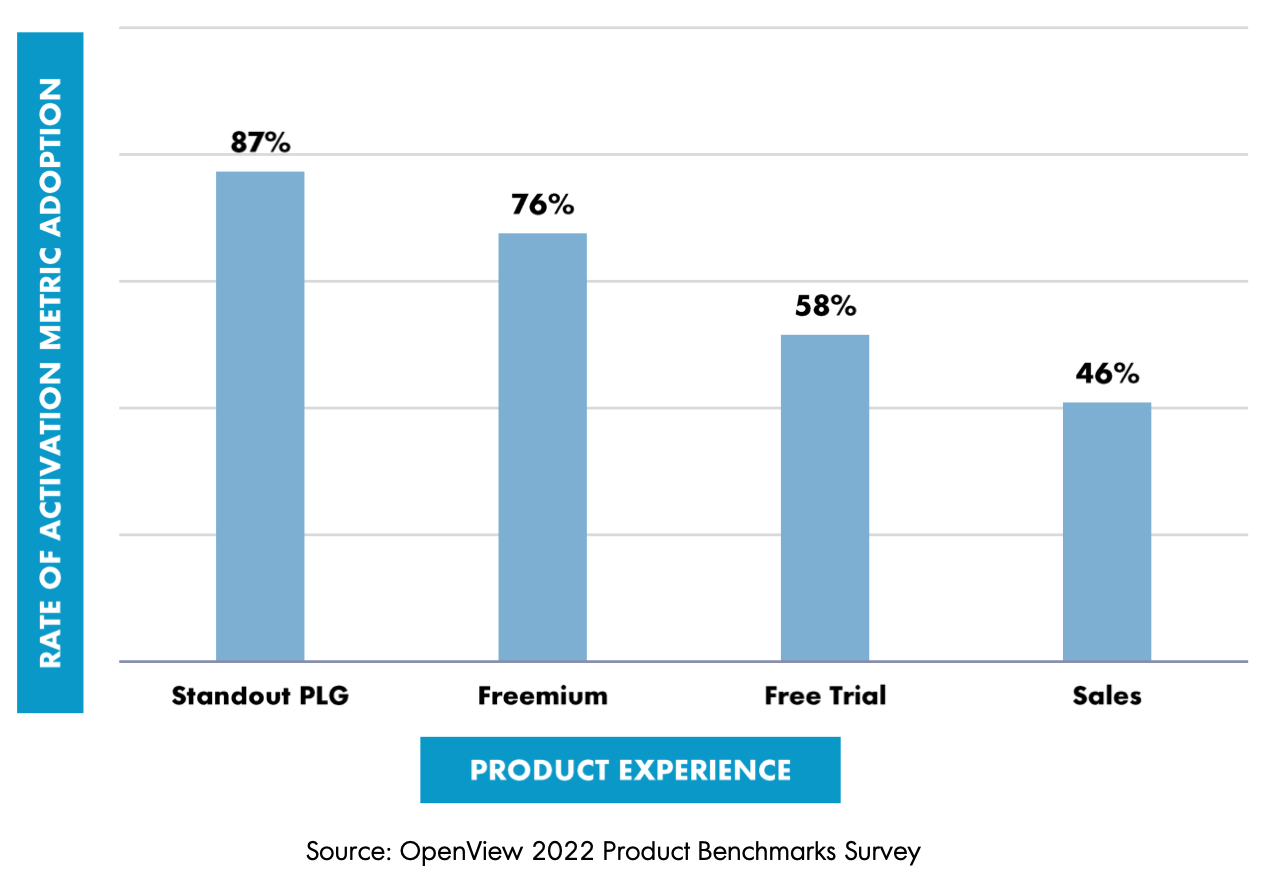
🕛 Time to Value (TTV): The time lag between signing up for the product and the "Aha" moment.
This should be as short as possible. The clock starts ticking the minute they sign up. B2B software companies target a 7 day TTV. B2C users are much more fickle and unforgiving. B2C TTV needs to be within minutes or hours after they sign up. It’s all about Speed - I think Keanu would agree…

Notes: For this metric to be an effective signal of activation, it is important to tightly define the aha moment. Appcues has a solid guide on how to think about Aha moment and how to define it. Don't pick overly broad vanity metrics. https://www.appcues.com/blog/aha-moment-guide
Customer Usage
1. Activity
After customers are activated, I like to dig into activity over time. It can be tempting to set a low bar for your definition of activity. “Users that log into the app” is a weak one. Pick your app’s core actions. For example: Hubspot’s core action might be creating or updating a deal. Then track activity metrics around this core action in discrete time intervals: daily, weekly, and monthly.
DAU: Daily active users are active at least once within a day
WAU: Weekly active users are active at least once within a week
MAU: Monthly active users are active at least once within a month
DAU % = 30 day Rolling Average daily users to take the core action in your app / All registered users * 100WAU % = 4 Week Rolling Average weekly users to take the core action in your app / All registered users * 100MAU % = 3 Month Rolling Average monthly users to take the core action in your app / All registered users * 100Usage metrics done right can be like a swiss army knife. Useful in a variety of ways. Segment customers that use the app daily vs monthly and investigate demographic and psychographic differences. Dive into usage patterns and how they differ between daily users and weekly users. It can also be an important indicator of customer health and can drive upsells - have a customer whose users went from predominantly being monthly active users to daily active users? That’s a great sign that they find your product very valuable and might want to expand usage.

It’s important to remember that these metrics aren’t one size fits all. Some businesses have naturally episodic usage. People only use Airbnb when they go on vacation every few months. Twitter and Instagram, in comparison, are more likely to have daily usage as users log on to get their daily running count of Elon’s children, learn about the latest crypto token to become insolvent, or simply to shitpost. Context is important.
2. Retention

When I love what I am eating, I eat more (my weighing machine hates this).
When I love what I am playing, I play more
When I love what I am wearing, I wear it more often and for longer
Similarly, the next best to evaluate if users love your product, is to investigate their retention - how long do they continue using the app. The best way to visualize this over time, is through a cohort analysis.
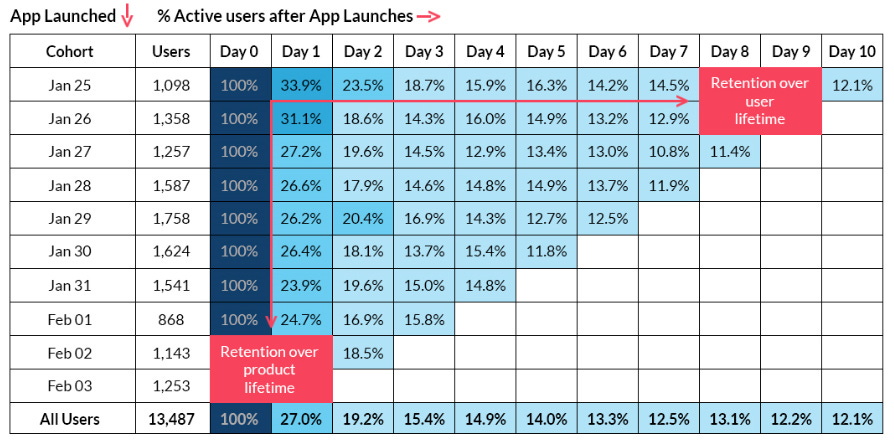
Cohort analysis is a nifty analysis tool to track usage and engagement over time by grouping users into cohorts based on when they first started using your products. When products are sticky, cohort analysis will show users sticking around long after they signed up. When products are a fad or solve a fleeting problem, cohort analysis will show users leaving in the first few weeks or months.
It can also be an innovative way to identify if your product is getting better. If it is, newer users will stick around for longer than older users. In fact, older users might be coming back because the product has improved by leaps and bounds.

Retention data is an important indicator of Customer Health. High usage, high retention customers are very healthy and likely present opportunities to upsell. Customers with low usage and low retention might be at risk of churn.
Successful companies proactively track these metrics early in the user’s journey and quickly take measures based on these data trends.
3. Time Share
“Time is our most valuable non-renewable resource” - Albert-László Barabási, Physicist
When I evaluate products, I am always curious about how much time customers spend in the app. It can be a valuable indicator of customer delight - they like using the product so much that they spend more & more time in your app.
There are caveats to this. I spend hours at the DMV because it takes hours to do what could otherwise be done in minutes. People are slow and insufferable and I never want to go back. If the DMV had a disingenuous CEO, they might point to “time spent in the DMV” as their core metric along with “Yearly Active Users” to convince investors that users love their product even though it's far from the case….
That’s why it's important to evaluate time spent in app in context, alongside NPS scores, active usage, and retention data to ensure that people are spending more time because they like your product, not because its clunky and hard to use.
Success Outcomes
Customers are paying you with time and money to use your product to solve their problem. Naturally, it’s important to objectively track the effectiveness of your solution. It’s important to understand how your customers are evaluating your software - what language do they use, what key metrics do they track and then make sure you track those same metrics too.
For example, products that help increase revenue, are generally going to be evaluated on return on investment (ROI) or a similar metric. Let’s say you sell a sales intelligence tool that helps companies identify new target leads. Your customers might evaluate you on: number of new leads you generate IN ADDITION to the new leads they generally get in a given time period. They might also evaluate the quality of these leads based on new closed ARR generated by your leads. Then, they might take that ARR in conjunction with the cost of your product to evaluate ROI.
If your product costs $100k and generates $1M in new ARR through your leads, the ROI would be 10x, which is very good. If your ROI < 1, your customers are losing money on your product and likely to churn (if they are smart). If you ROI is >3-5x, your customers will be happy and your money printer will likely go brrr…
ROI = New Revenue (or Decrease in Cost) / Cost of the Product * 100
Thoughtful identification and proactive, sophisticated tracking of product metrics creates a solid foundation to understand and scale high potential businesses. While not an exhaustive list of product metrics, these are great standard metrics to begin evaluating effectiveness of your product and capture implicit customer feedback to drive product decisions. Plus, nicely packaged product metrics can drastically boost your fundraising process.